Provenance Graph
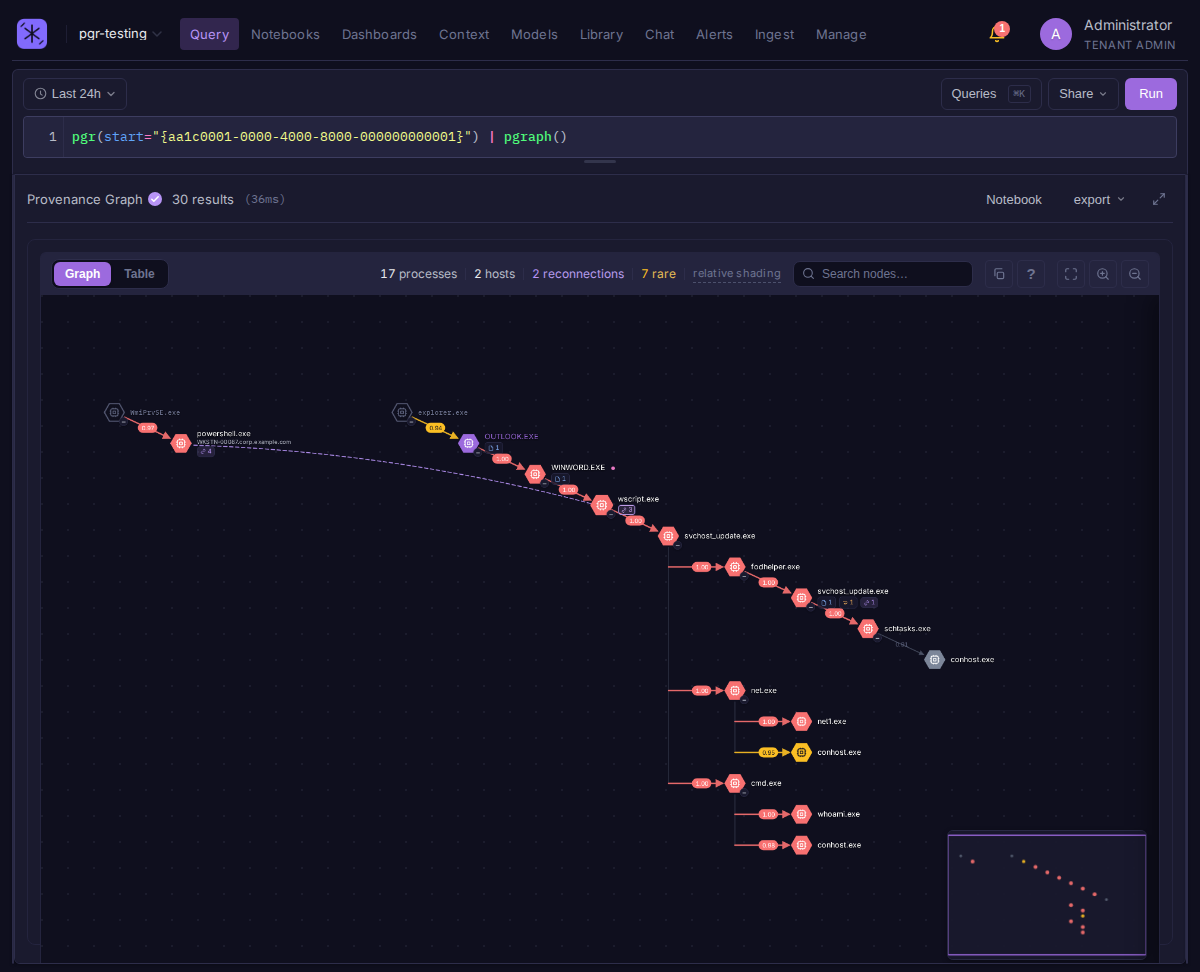
The provenance graph (pgr()) reconstructs what a suspicious process did and cuts it down to what matters. Point it at a single process and it rebuilds the spawn tree, scores every file, network, DNS, and injection action by how unusual it is, and prunes the everyday noise, so a handful of suspicious actions surface instead of thousands of raw events to sift through.
Enabling it
Provenance requires baselines built from your endpoint logs, so it is off by default. An admin turns it on under Admin > Settings > Features > Endpoint behavioral analytics.
When enabled, Bifract maintains two lightweight baselines as logs arrive: process lineage (who spawned whom) and behavior frequency (how common each file, IP, and domain is across your fleet). These run on every ingested log, so leave the toggle off unless you use these features. When you re-enable it, baselines resume from that point forward.
Requirements
Provenance needs an endpoint/EDR source (for example Sysmon). Set the query time range to cover the whole investigation window; lineage outside the selected range is not included.
Required fields and categories
Provenance reads from a small set of normalized fields. Your normalizer must map each source event to a bifract_category and populate the fields below (all field names are relative to the fields column). The graph works from whichever categories you send: process_creation alone builds the spawn tree, and each additional category adds that layer of activity.
Every event should also carry computer_name (the host) and an event timestamp.
bifract_category |
Adds | Required fields |
|---|---|---|
process_creation |
The spawn tree (required backbone) | process_guid, parent_process_guid, image, parent_image, commandline, computer_name |
file_write |
Files a process wrote | process_guid, image, target_file, computer_name |
network_connect |
Outbound network destinations | process_guid, image, dst_ip, computer_name |
dns_query |
Domains a process resolved | process_guid, image, query, computer_name |
remote_thread |
Process injection edges (opt-in, see below) | source_process_guid, target_process_guid, image, target_image, computer_name |
process_access |
Handle-access edges (opt-in, see below) | source_process_guid, target_process_guid, image, target_image, computer_name |
Injection edges are opt-in
pgr() generates file_write, net_connect, and dns_query leaves by default. remote_thread and process_access are not generated unless you ask for them, because they key off source_process_guid, which has no skip index: including them forces an unindexed full-window scan per branch. Request them explicitly when you need them:
pgr(start="{GUID}", include="remote_thread,process_access") | pgraph()
Optional fields
user (on process_creation) is shown in a process's detail panel, and query_results (on dns_query) lets reconnection match resolved IPs as well as domains. Neither is required for the graph to build.
These map directly to Sysmon events: process_creation = 1, network_connect = 3, dns_query = 22, file_write = 11, remote_thread = 8 (Sysmon CreateRemoteThread), process_access = 10.
Using it
Run pgr() seeded on a process, then pipe to pgraph() to visualize:
pgr(start="{GUID}") | pgraph()
pgraph() also renders a plain process tree from ptg():
ptg(start="{GUID}") | pgraph()
That is the same canvas with process creation only: no anomaly scoring, no file/network/DNS activity, and no reconnection, since ptg() reads the process-lineage table alone. Use it when you want the spawn tree quickly, or when behavioral analytics is off; use pgr() when you want to know which parts of that tree are unusual.
Anomaly scoring
Every action gets an anomaly_score from 0 to 1, where 1 is never-seen-before and 0 is ubiquitous across your environment. Rare behavior surfaces; common noise fades. Scoring also follows the chain, so a sequence of individually-common steps (a classic living-off-the-land pattern) adds up and stands out even when no single step looks unusual on its own.
Reconnection
pgr() also pulls in other process trees that share a rare artifact with the one you seeded: a file this tree wrote that another tree then executed, or the same rare external IP or domain touched by both. That is how lateral spread shows up without you hunting for it. Only artifacts that are rare across your fleet bridge, so shared CDNs, resolvers, and update servers do not reconnect everything.
Each reconnected peer arrives as its own tree on the canvas, so the number admitted is capped at the 50 strongest bridges (a peer reached through several rare artifacts ranks above one reached through a single IP). Tune it with peers=:
pgr(start="{GUID}", peers=200) | pgraph()
Use reconnect=false to show only the seeded tree.
The graph's reconnections stat counts linked process pairs, and reads 50 of 312 when the view is showing the strongest ones. Hovering it reports how many distinct bridges (shared artifacts) are behind those pairs, which is usually the smaller and more useful number: one rare domain touched by twenty processes is one bridge, not twenty.